2Q 2025 Industrial Property Market: Recovery Tempered by Caution as Global Headwinds Loom in 2H 2025
- Egan Mah Jixiang
- 6 min read
- Research
- 29 Aug 2025
Economic Overview
Singapore’s economy expanded 4.4% year-on-year (y-o-y) in 2Q 2025 reflecting better-than-expected economic growth in 1H 2025. In line with this, the Ministry of Trade and Industry (MTI) had upgraded Singapore’s GDP growth forecast from “0.0% to 2.0%” to “1.5% to 2.5%” for the whole of 2025. Nonetheless, the persistent global uncertainty is likely to cap Singapore’s economic outlook for 2H 2025.
Despite the weaker Purchasing Manager Index (PMI), key economic indicators such as the Non-Oil Domestic Exports (NODX) and manufacturing output rose in 2Q 2025. These expansions were mainly due to front-loading activities in anticipation of U.S. trade tariffs.
Chart 1: Singapore GDP Growth in Chained dollars
 Source: MTI, ERA Research and Market Intelligence
Chart 2: Non-Oil Domestic Exports and Manufacturing Exports
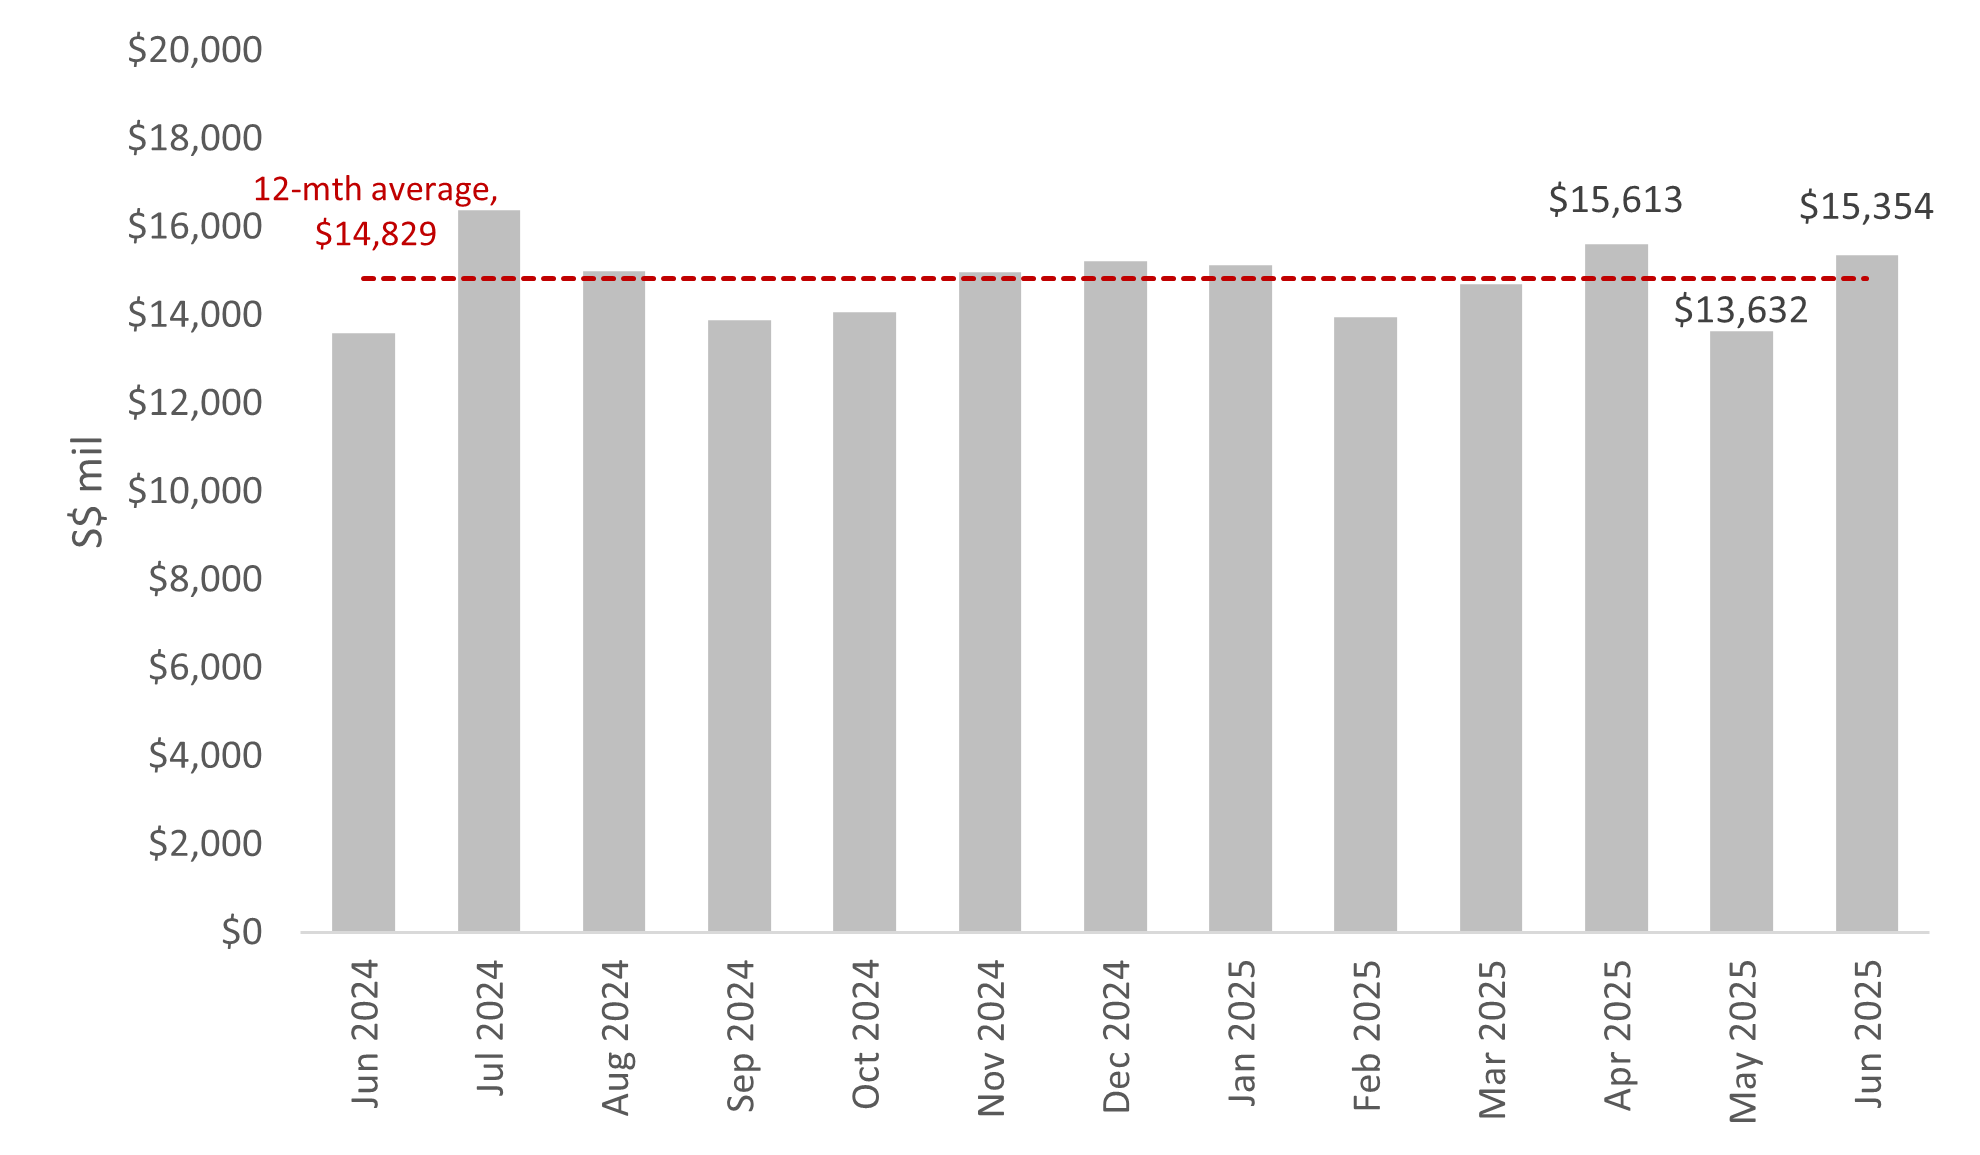 Source: Singstat, ERA Research and Market Intelligence
Chart 3: Manufacturing Output y-o-y Change
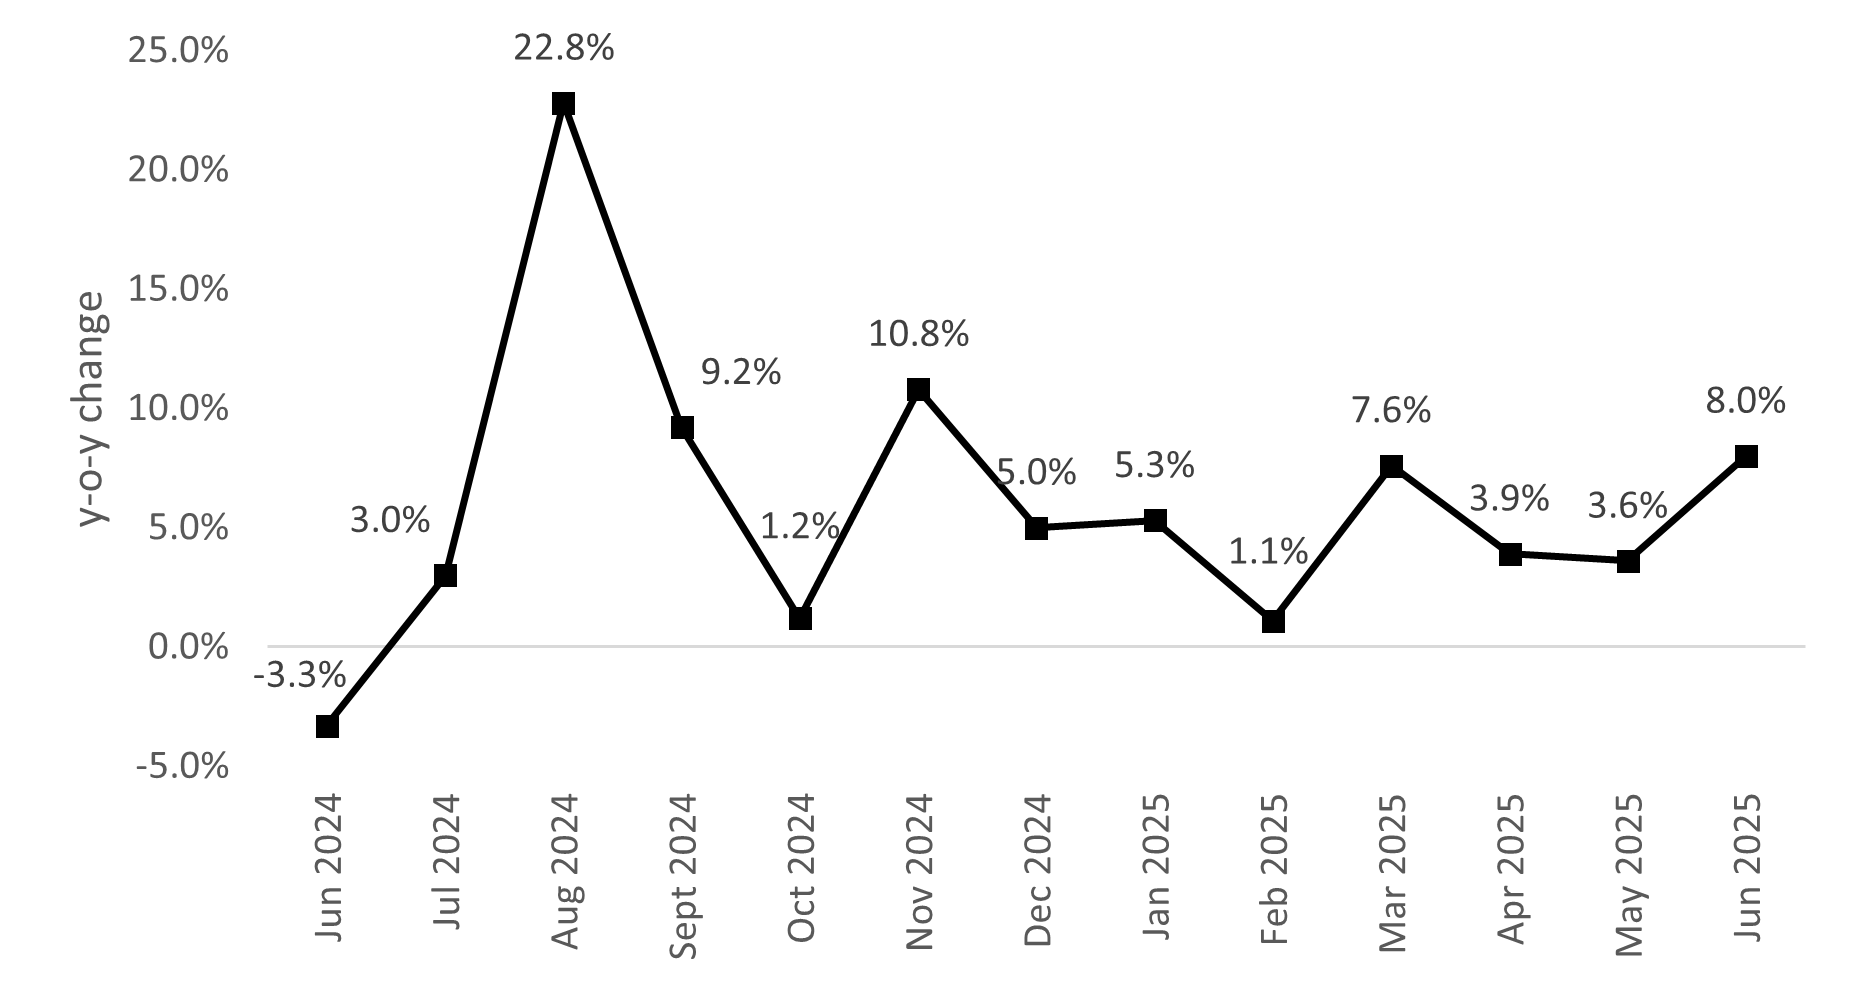 Source: Singstat, ERA Research and Market Intelligence
Chart 4: Purchasing Manager Index
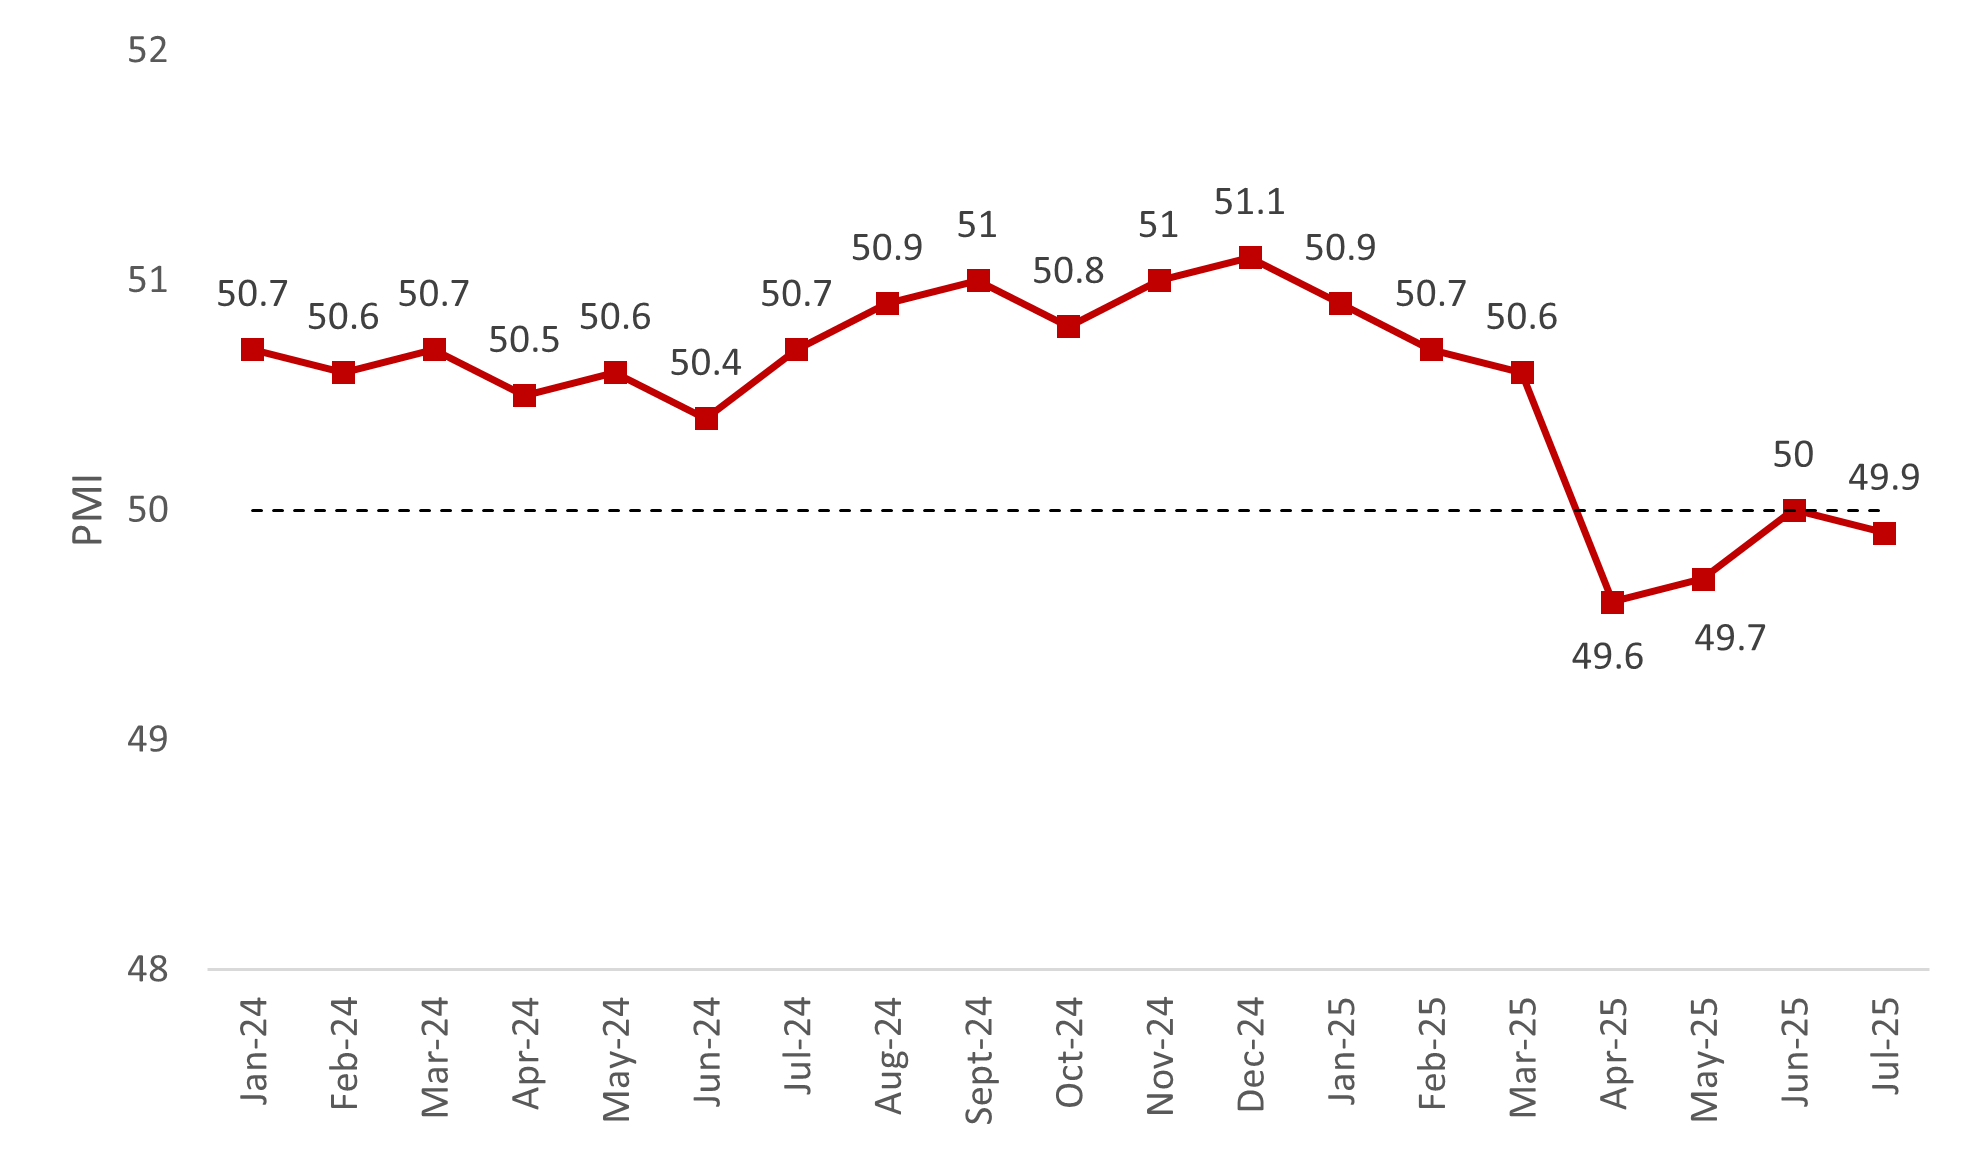 Source: SIPMM, ERA Research and Market Intelligence
*The PMI reading with a score above 50 indicates that the manufacturing economy is generally expanding and that the economy is generally declining when the reading falls below 50, and a score of 50 indicates no change from the previous month.
Price and Sales Transaction Volume
Overall, the Industrial Property Price Index grew by 1.4% q-o-q in 2Q 2025 to 109.6. This uptick was marginally lower than the 1.5% growth seen in 1Q 2025. The increase was largely led by multiple-user factories which rose 1.7% q-o-q, alongside a 0.4% q-o-q growth for multi-user factories.
Multiple-user factory transaction volume rose by 7.4% q-o-q, marking a rebound after three consecutive quarters of decline. Meanwhile, single-user factory transactions continued their strong growth momentum in 2Q 2025, increasing by 36.6%, following a 36.8% rise in 1Q 2025.
Chart 5: Price Index and Transaction Volume
![]() Source: URA and JTC JSpace as of 18 July 2025, ERA Research and Market Intelligence
Source: URA and JTC JSpace as of 18 July 2025, ERA Research and Market Intelligence
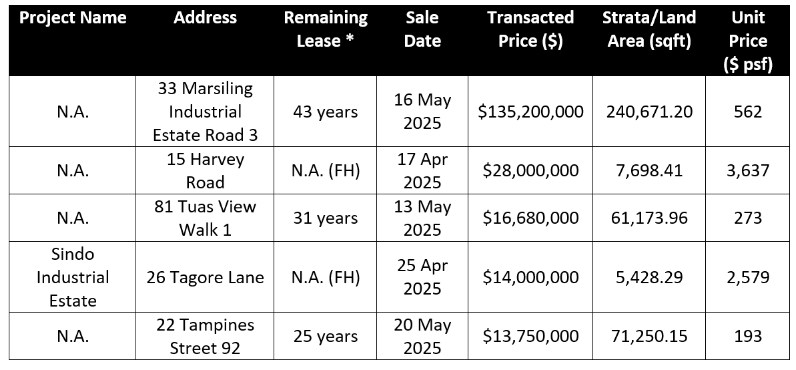
The top transaction in 2Q 2025 was the sale of 33 Marsiling Industrial Estate Road 3 for $135.2 million. It was part of Mapletree Industrial Trust’s divestment strategy to Brookfield Asset Management, where three assets were collectively sold for $535.2 million. The other assets include the neighbouring 35 Marsiling Estate Road 3 and The Strategy and The Synergy, both at International Business Park. However, their caveats were not lodged.
Another notable transaction made this quarter was Macpherson Industrial Complex, sold via collective sale for $103.9 mil in May 2025. The freehold building, zoned B1-Industrial, drew 12 tender submissions, underscoring strong demand for centrally located industrial buildings with access to major expressways, and proximity to transport nodes and food amenities. However, its caveats have not been lodged till date.
In the Industrial Government Land Sales (IGLS) space, JTC awarded one industrial site. The 4,876 sqm site at Gul Drive had drawn seven bidders. The site was sold on a 23-year lease for $4.8 million, or $65.3 per square foot per plot ratio (psf ppr).
Table 1: Top Five Sales Transactions in 2Q 2025, based on caveats lodged
 Source: URA as 18 July 2025, ERA Research and Market Intelligence
Leasing and Leasing Volume
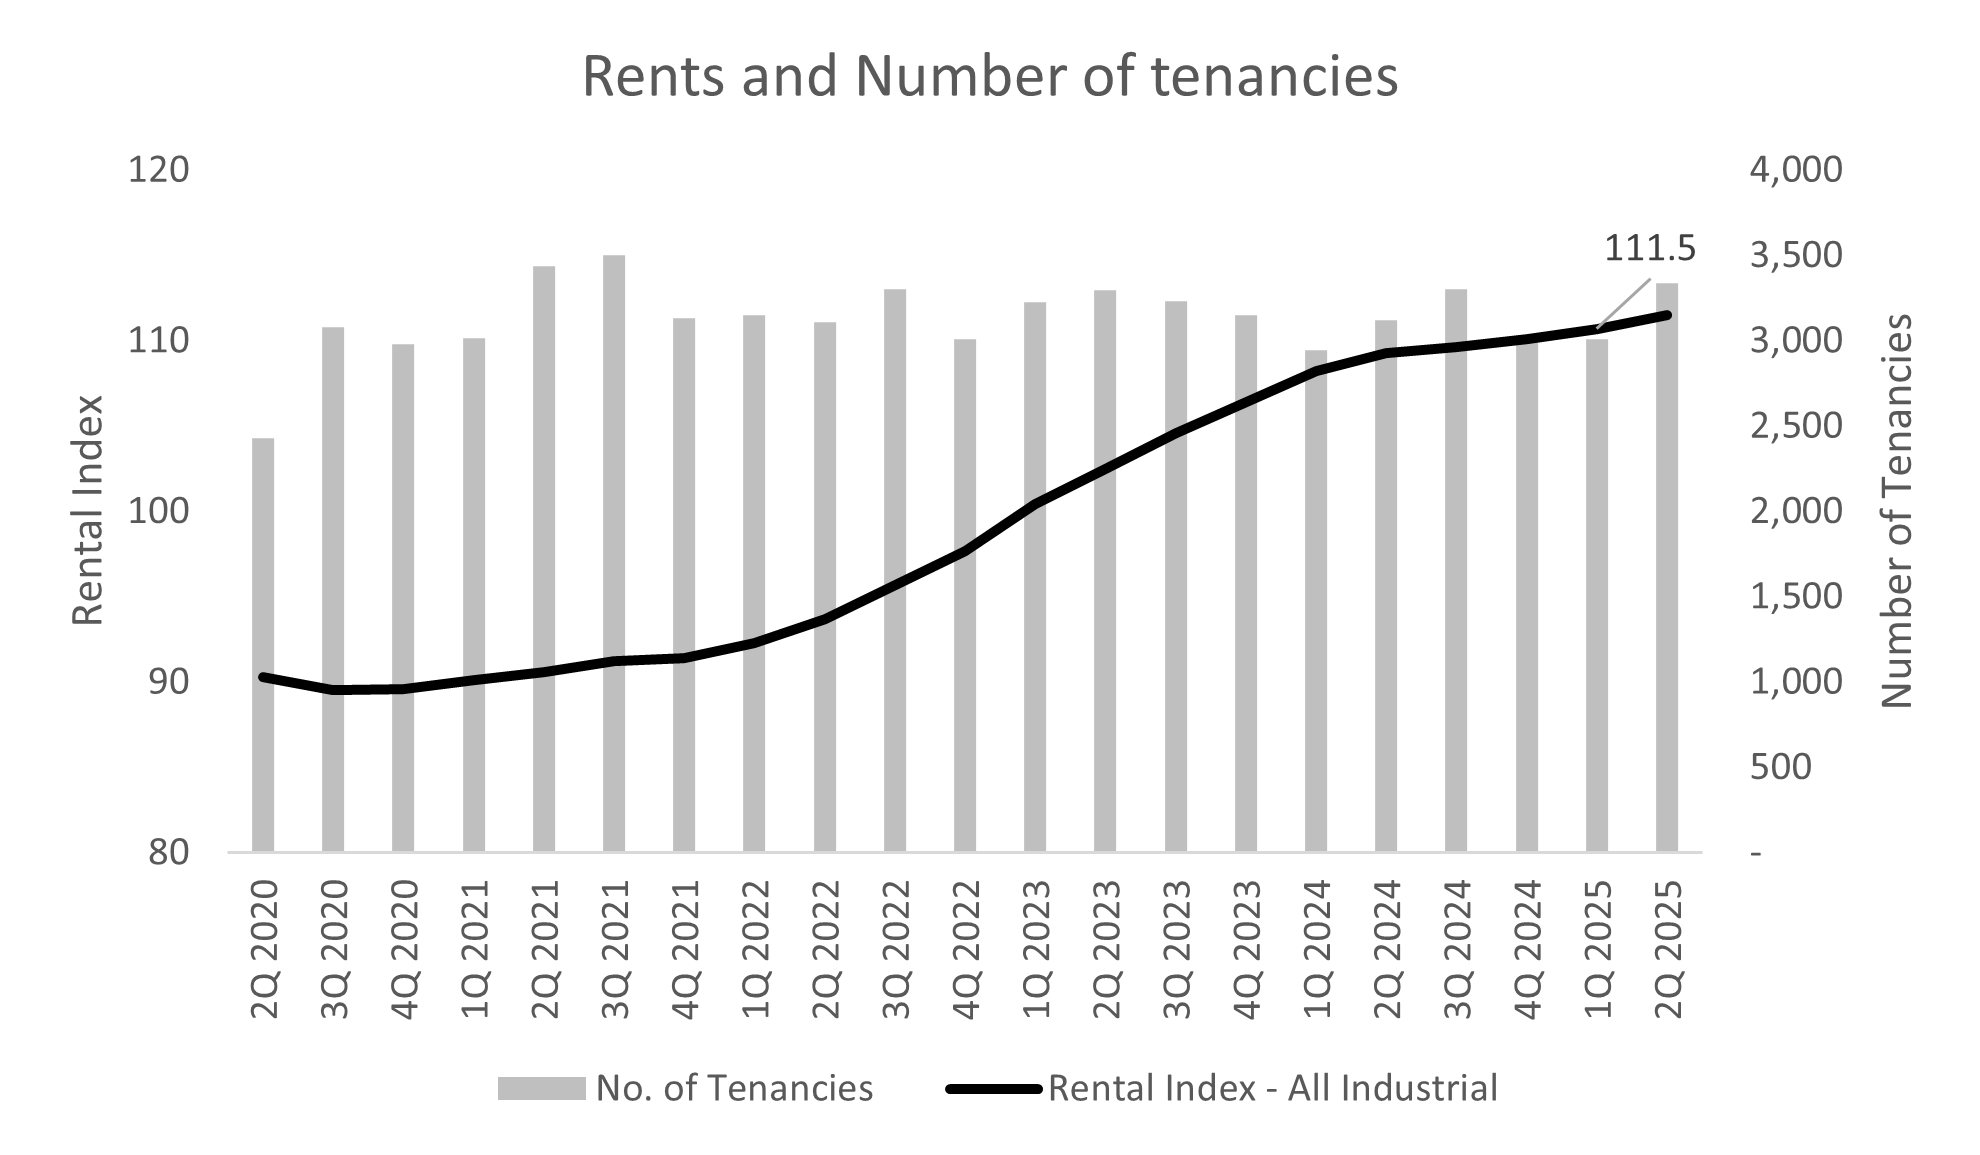
The JTC All Industrial rental index continued its upward trend, rising for the nineteenth consecutive quarter in 2Q 2025. Rents grew by a further 0.7% q-o-q, extending the 0.5% growth seen in the previous two quarters.
In particular, Business Parks rents grew the fastest this quarter, rising 1.2% q-o-q, a similar pace as 1Q 2025. Newly completed developments in recent months such as those in Punggol Digital District and Geneo in Singapore Science Park have driven rents upwards. They typically command higher rents as buildings and spaces comes with higher specs and newer sustainability or smart features.
Moreover, the higher rents were largely due to stronger leasing demand. Leasing volume rose 10.9% q-o-q to 3,337 rental transactions in 2Q 2025, reversing the two consecutive quarters of decline. Rents have been rising due to newly completed developments in recent months.
With rents are on an upward trajectory, firms with expansion plans may consider locking in leases early to avoid higher rental prices down the line. Moreover, with more uncertainties brought about by the global tariffs, companies may seek to rent rather than purchase a business space to minimise risks.
Chart 6: Rental Index and Number of Tenancies for Industrial Properties
 Source: JTC JSpace, ERA Research and Market Intelligence
Chart 7: Rental index by property type
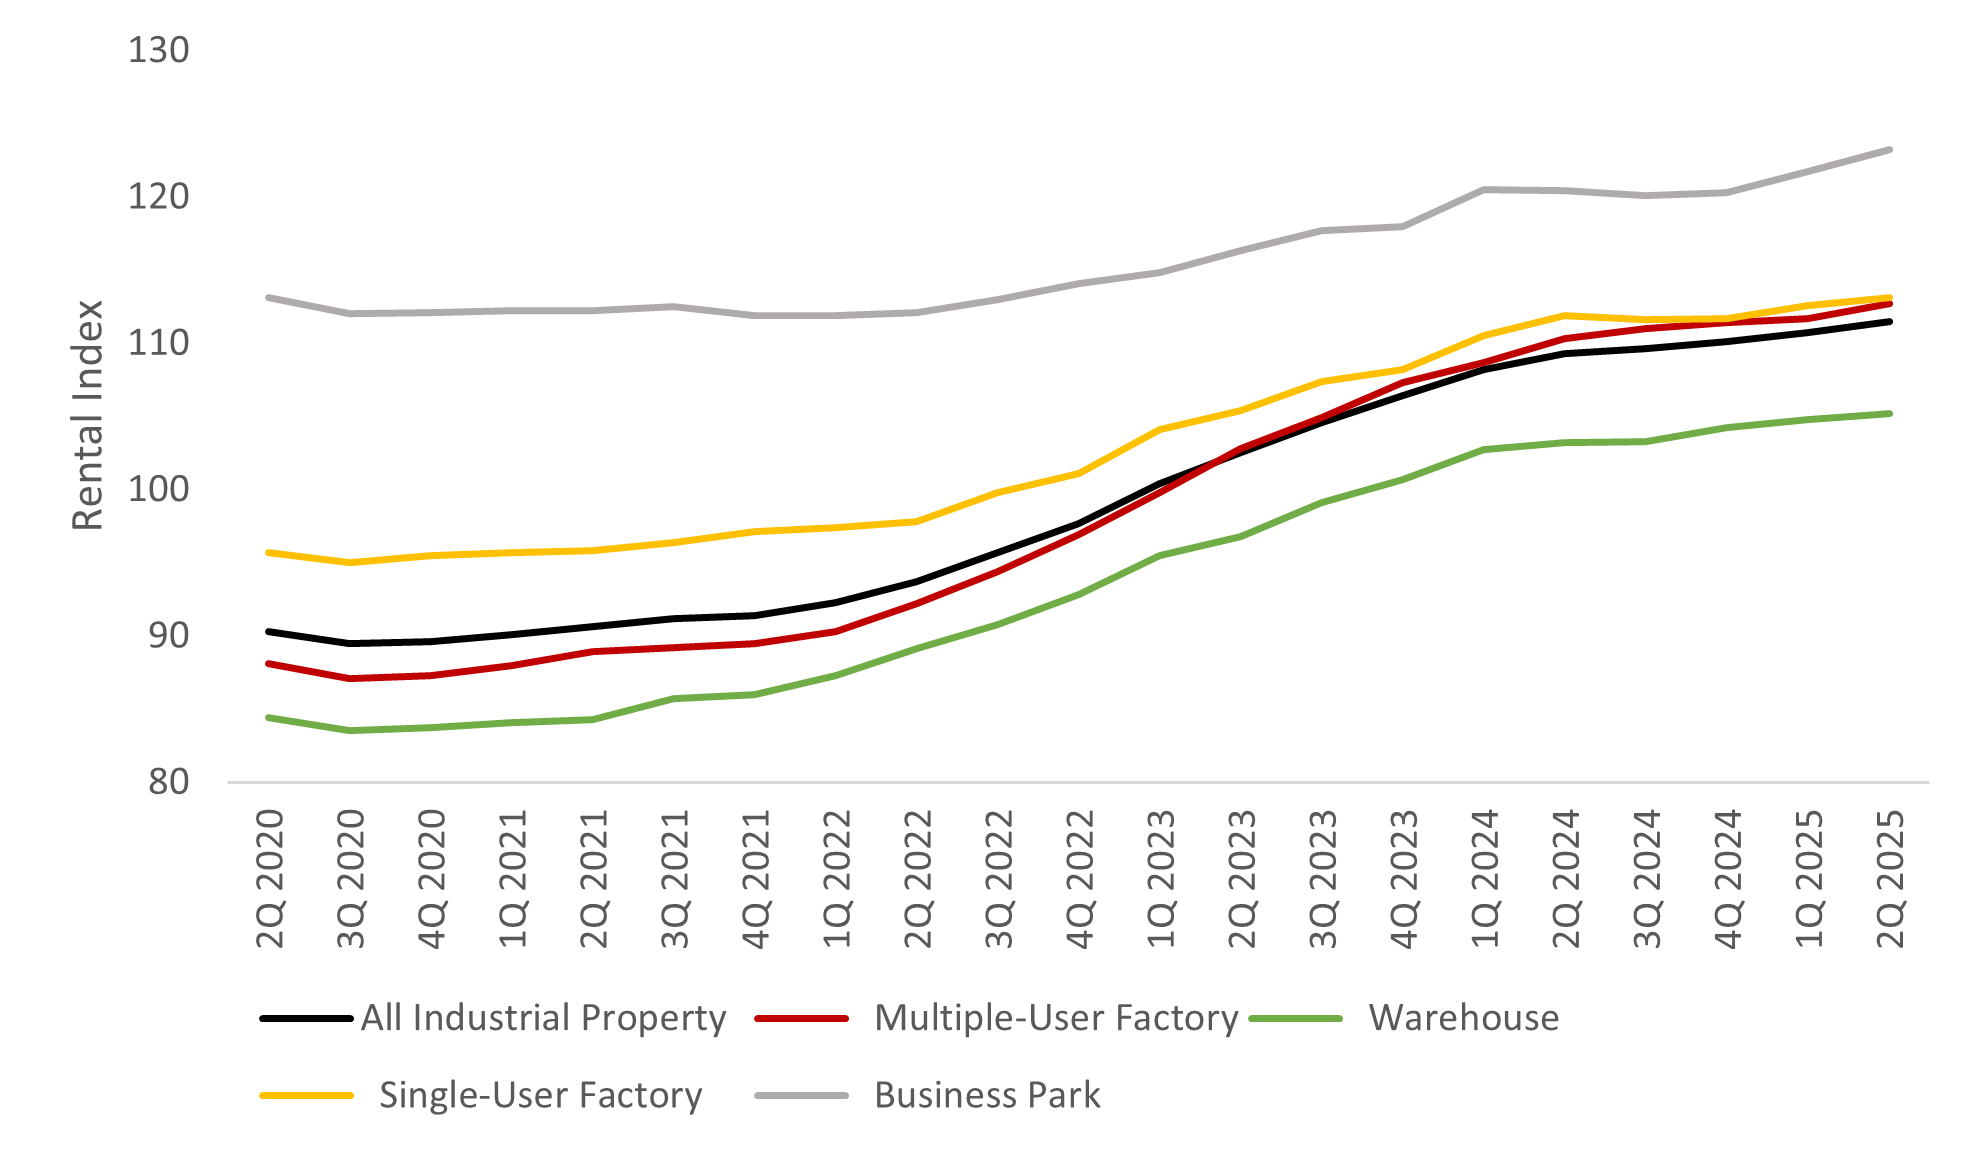 Source: JTC JSpace, ERA Research and Market Intelligence
While the rental index continues its upward trend, its take-up rates have been relatively healthy. Currently, the two-year average occupancy standing at 90.3%. This comes despite substantial new completions in recent months such as the Punggol Digital District, Geneo and JTC Space @ Ang Mo Kio. These resulted in the overall occupancy rate facing slight dips in the recent quarters. However, as much of the leases have been pre-signed, the impact of low occupancy rate is minimised.
Chart 8: Industrial Properties Occupancy Rates
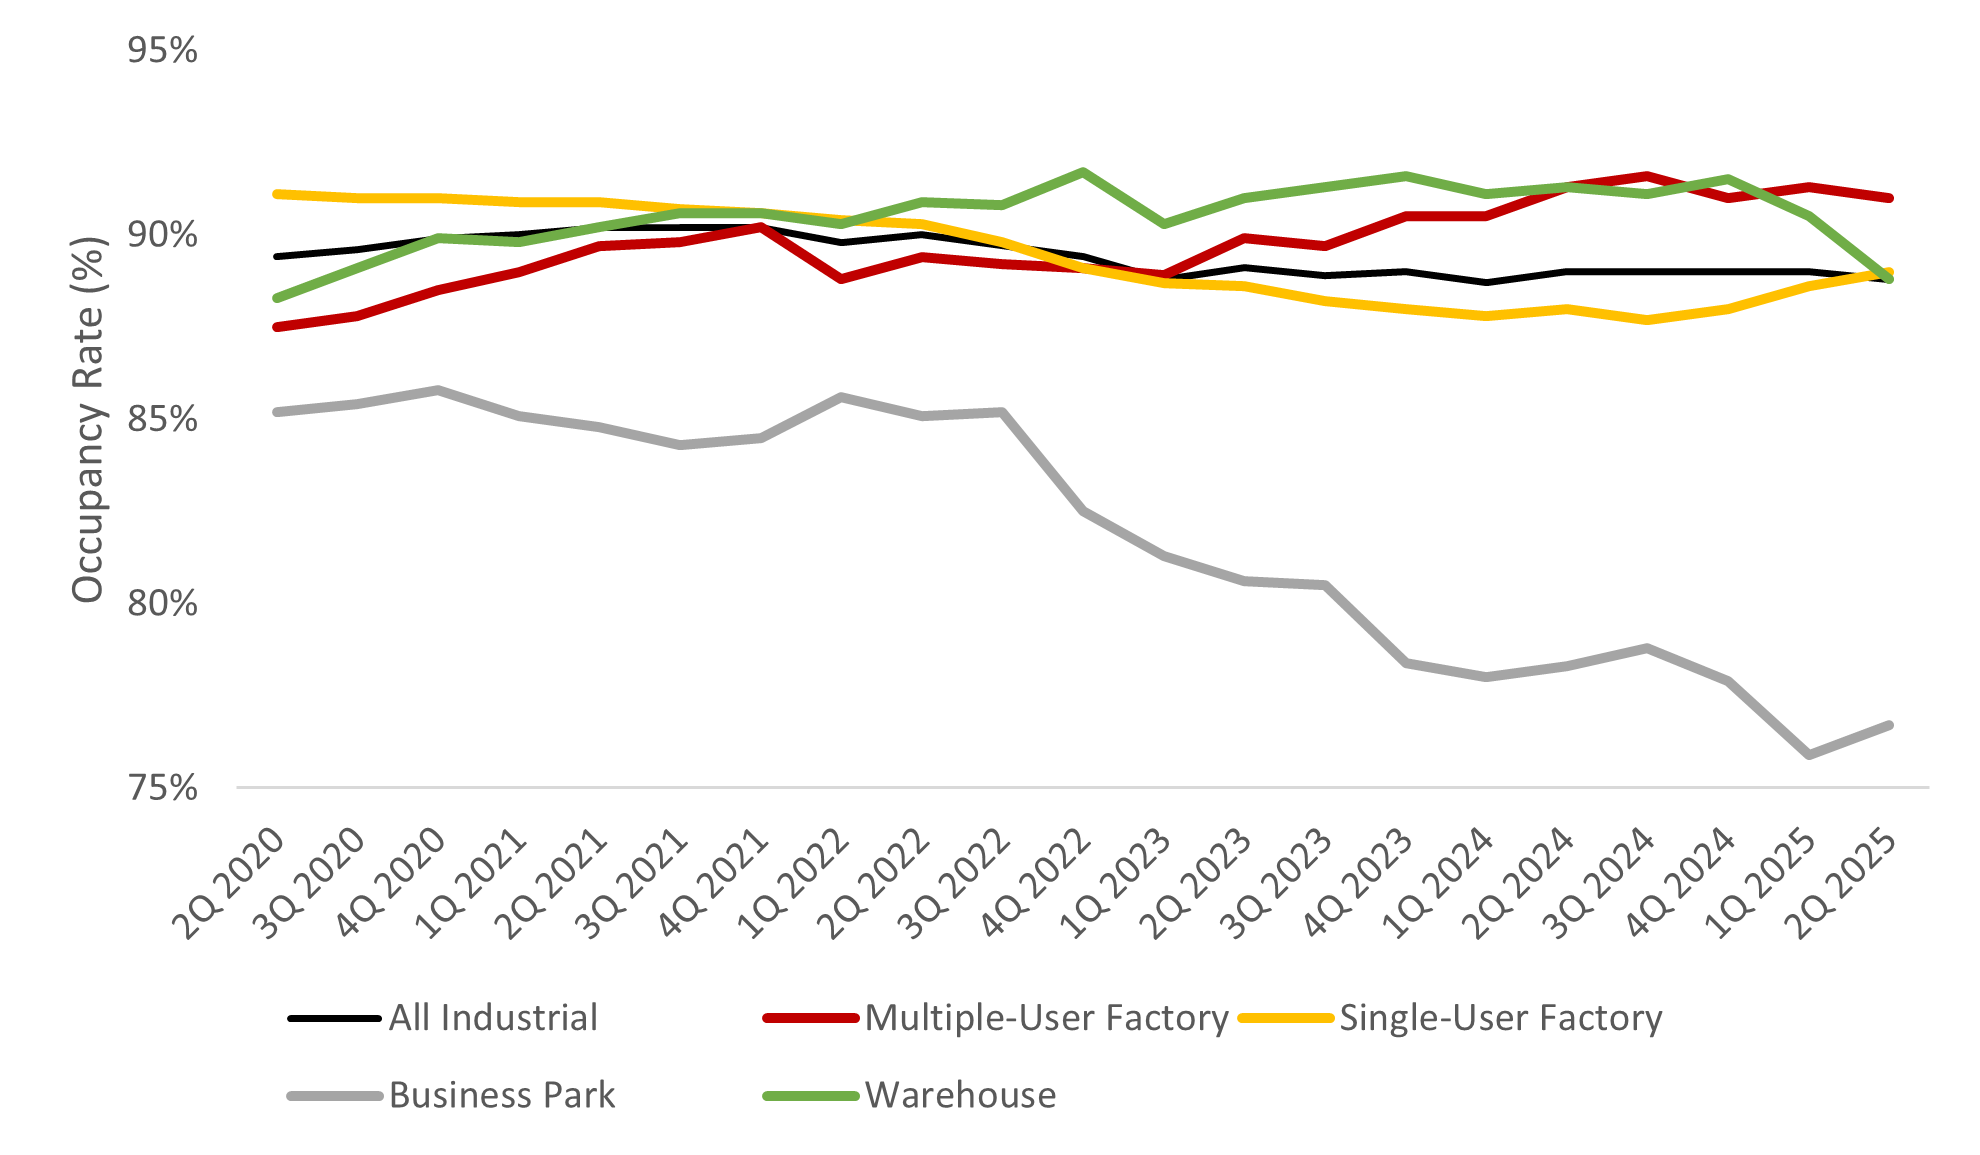 Source: JTC, ERA Research and Market Intelligence
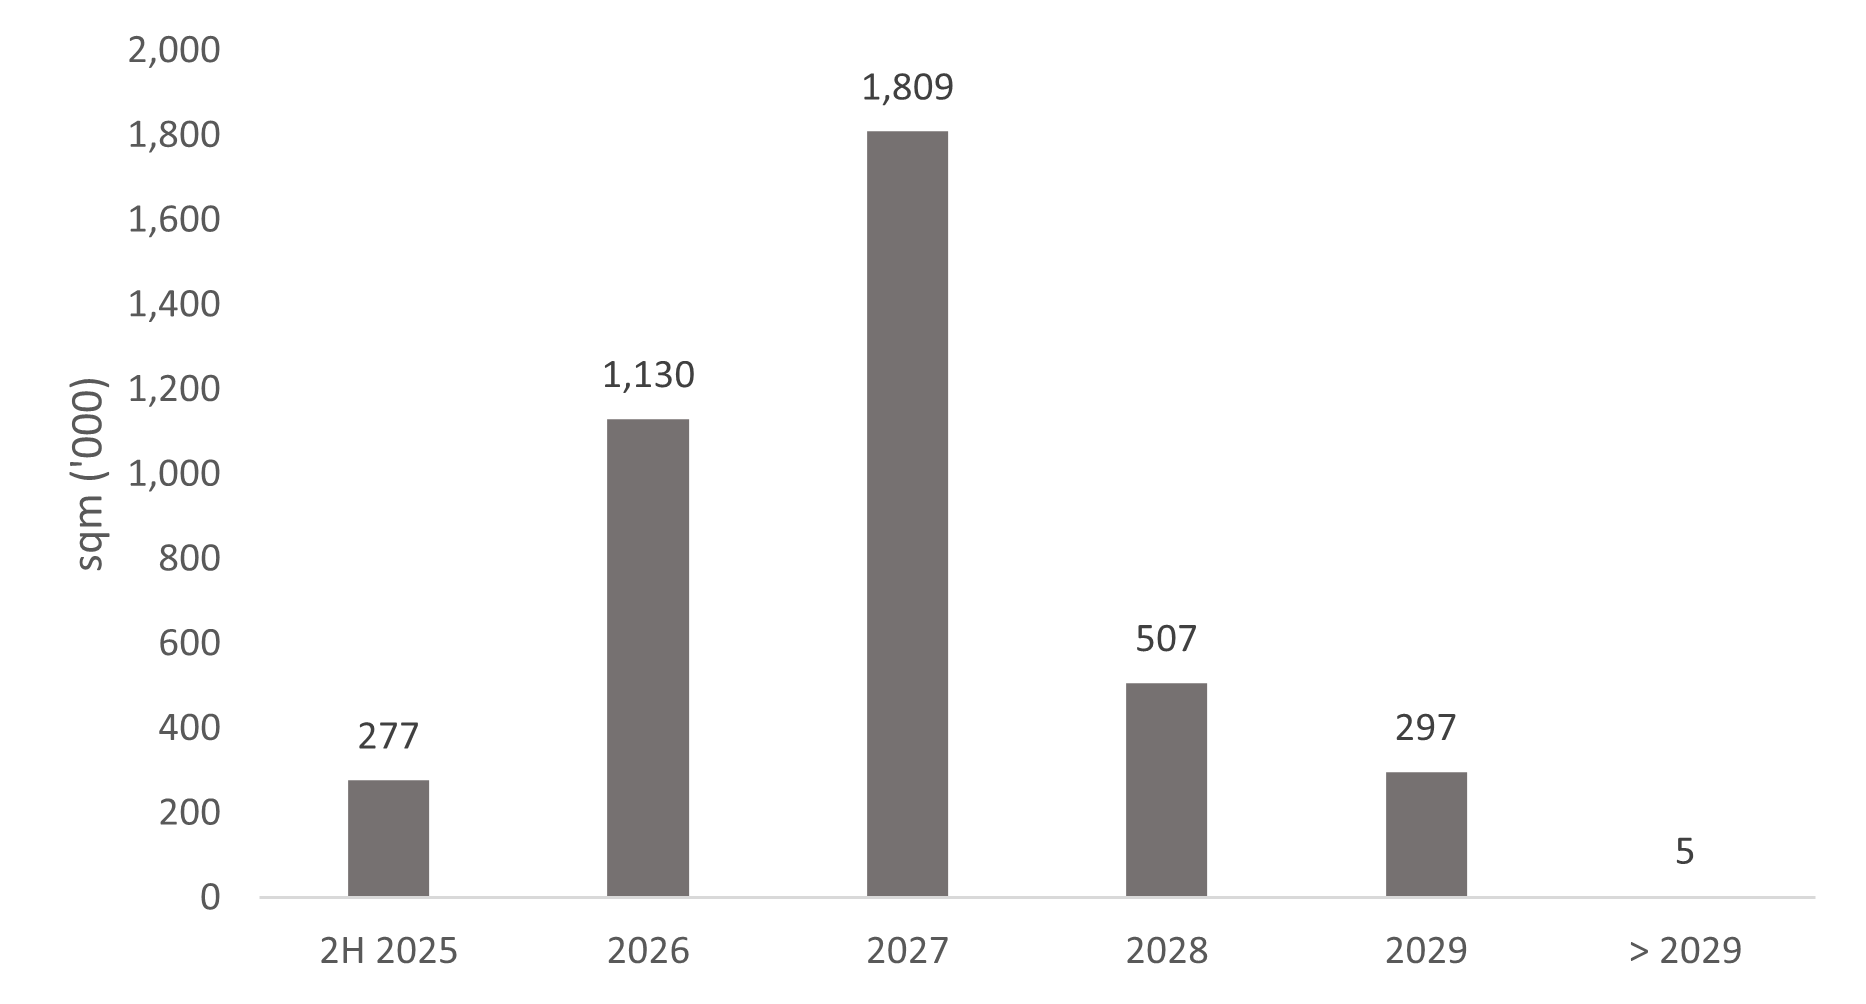
Upcoming Supply
In the 2H 2025, another 13 new industrial developments are slated for completion, injecting 277,000 sqm of industrial space into the market. Some notable developments include a warehouse space at Toh Guan Road East (50,920 sqm), Bulim Square by JTC Corporation (74,780 sqm) and a Single-user industrial development at Pasir Ris Industrial Drive 1 (37,520 sqm).
This slew of completions could cater to the demand for industrial spaces. Since some of these leases have already been pre-committed, the occupancy rate is expected to remain stable.
Chart 9: Supply of Industrial Spaces' Expected Completion Year
 Source: JTC JSpace, ERA Research and Market Intelligence
In conclusion
The looming US tariff threats could weigh on global trade demand which may soften import and export activities. This may prompt firms to take on a cautious stance in their expansionary plans.
Amidst a transition to a multipolar world order, Singapore may be well-placed to capture offshoring demand, particularly in the advanced manufacturing sectors. This is given Singapore’s lower trade tariff of 10% and extensive free trade agreements. Should that materialise, the resulting investment inflows are likely to have positive downstream effects on small- and medium-sized enterprises in supporting industries. Moreover, if the Fed cuts its rates in September 2025, this could renew buying interest.
Collectively, the Industrial Property Price Index and Rental Index rose 2.9% and 1.3% in 1H 2025 respectively. In view of the stronger growth registered, ERA revises our full year forecast for industrial prices to between 3% to 5%. Rents are also forecasted to rise between 2% to 4% for the full year in 2025.
I confirm that I have read theprivacy policy and allow my information to be shared with this agent who may contact me later.