3Q 2025 Industrial Property Market: Industrial Sector Remains Resilient Despite Global Uncertainty
- Egan Mah and Kwong Seong Ping
- 7 min read
- Research
- 3 Dec 2025
Economic Overview
Singapore’s economy grew by 2.9% year-on-year (y-o-y) in the third quarter of 2025, surpassing earlier forecasts of 2% growth amid US tariffs. The Ministry of Trade and Industry (MTI) had earlier upgraded Singapore’s GDP growth forecast from “0.0% to 2.0%” to “1.5% to 2.5%” for the entire year of 2025 in August.
However, the 2.9% growth is slower than the 4.1% and 4.5% seen in the previous two quarters. Growth may continue to slow in the coming quarters as global uncertainties, geopolitical tensions, and tariffs are imposed. In particular, US tariffs on semiconductors and pharmaceuticals, two of Singapore’s key economic drivers, will present a downside risk to Singapore’s economic outlook going forward.
While the macroeconomic outlook remains uncertain, interest rates have been falling since the end of 2024. This has boosted overall affordability, allowing firms to take up space and expand their business operations. The Purchasing Manager Index (PMI) has fluctuated between 49.9 and 50.1 from July to September 2025. This marks an increase from the 49.6 and 49.7 seen in April and May 2025, respectively, indicating early signs of a potential rebound. Other key economic indicators, such as Non-Oil Domestic Exports (NODX) and manufacturing output, have stayed fairly stable, even as the effects of front-loading activities caused by tariffs are diminishing.
This has encouraged some firms to expand their business activities as they navigate uncertain times.
Chart 1: Singapore GDP y-o-y growth in chained dollars
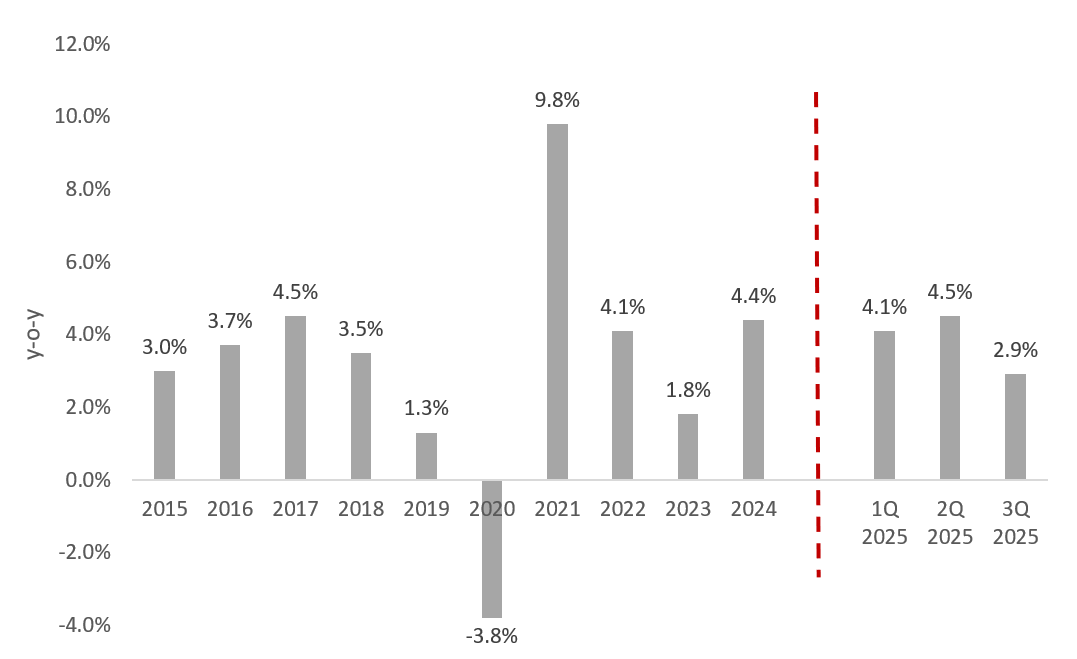
Chart 2: Non-Oil Domestic Exports and Manufacturing Exports
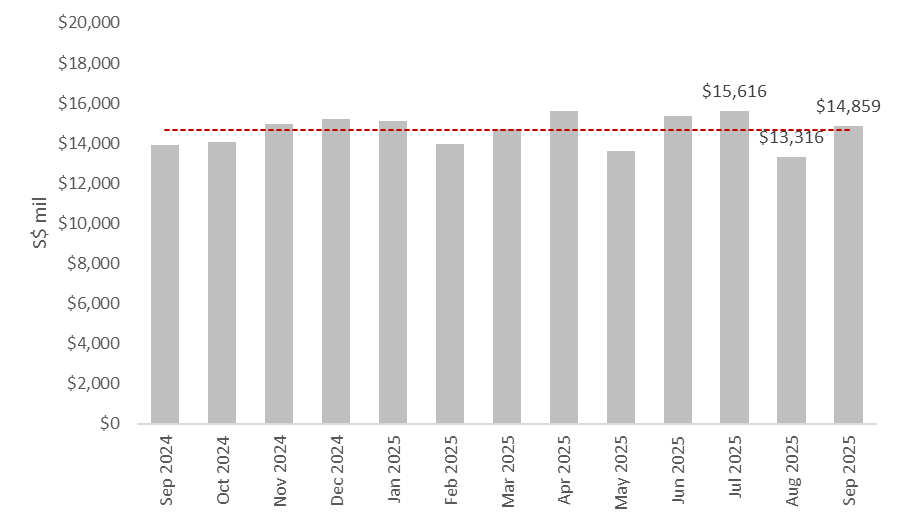
Chart 3: Manufacturing Output y-o-y Change
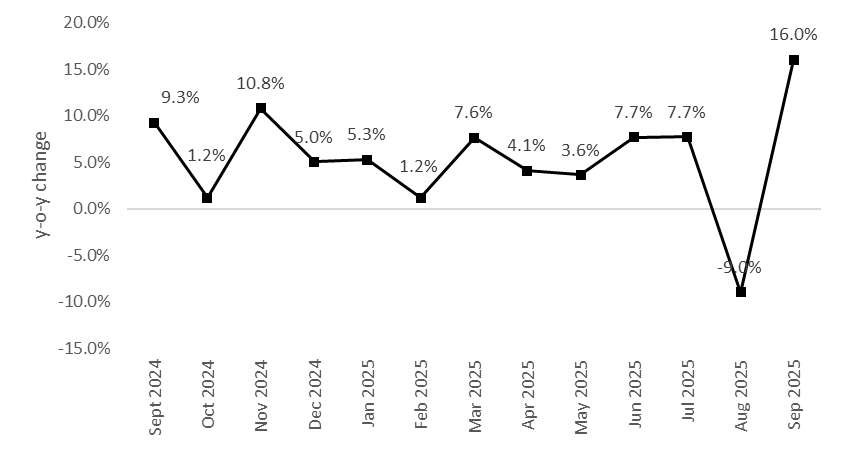
Chart 4: Purchasing Manager Index
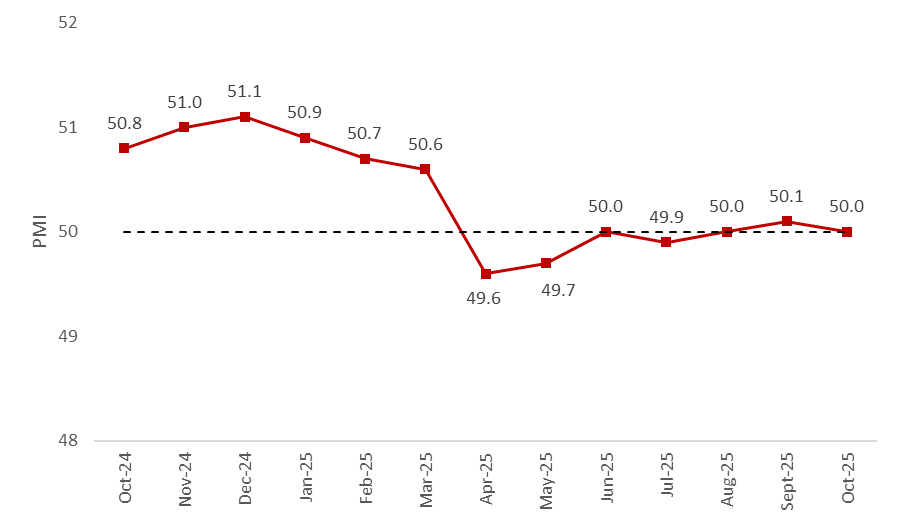
*The PMI reading with a score above 50 indicates that the manufacturing economy is generally expanding, and that the economy is generally declining when the reading falls below 50, and a score of 50 indicates no change from the previous month.
Price and Sales Transaction Volume
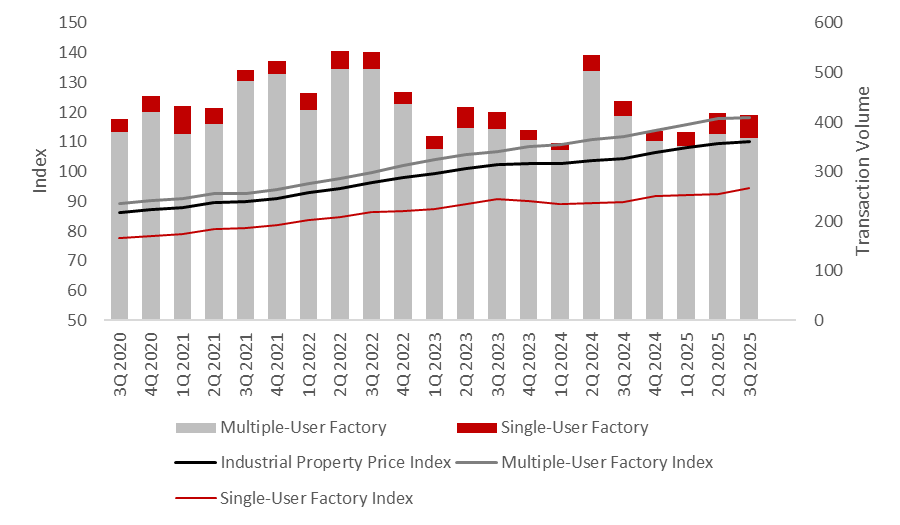
Overall, the Industrial Property Price Index increased by 0.6% quarter-on-quarter in 3Q 2025 to 110.3. This increase was modest compared to the 1.4% rise seen in 2Q 2025. Nevertheless, it marked the sixth consecutive quarter of rising prices, with the index now at an all-time high.
In contrast to the previous quarter, this increase was mainly driven by single-user factories, which rose by 2.1% quarter-on-quarter, while prices in multi-user factories grew by just 0.1% quarter-on-quarter. Previously, the growth in prices was due to a 1.7% increase in multi-user factory prices.
Multiple-user factory transaction volume fell by 2.1% quarter-on-quarter, reversing the 7.1% rise seen in the previous quarter. Meanwhile, single-user factory transactions maintained their strong growth momentum in 2Q 2025, increasing by 9.5% to 46 transactions, following a 50.0% rise in 2Q 2025.
Chart 5: Price Index and Transaction Volume
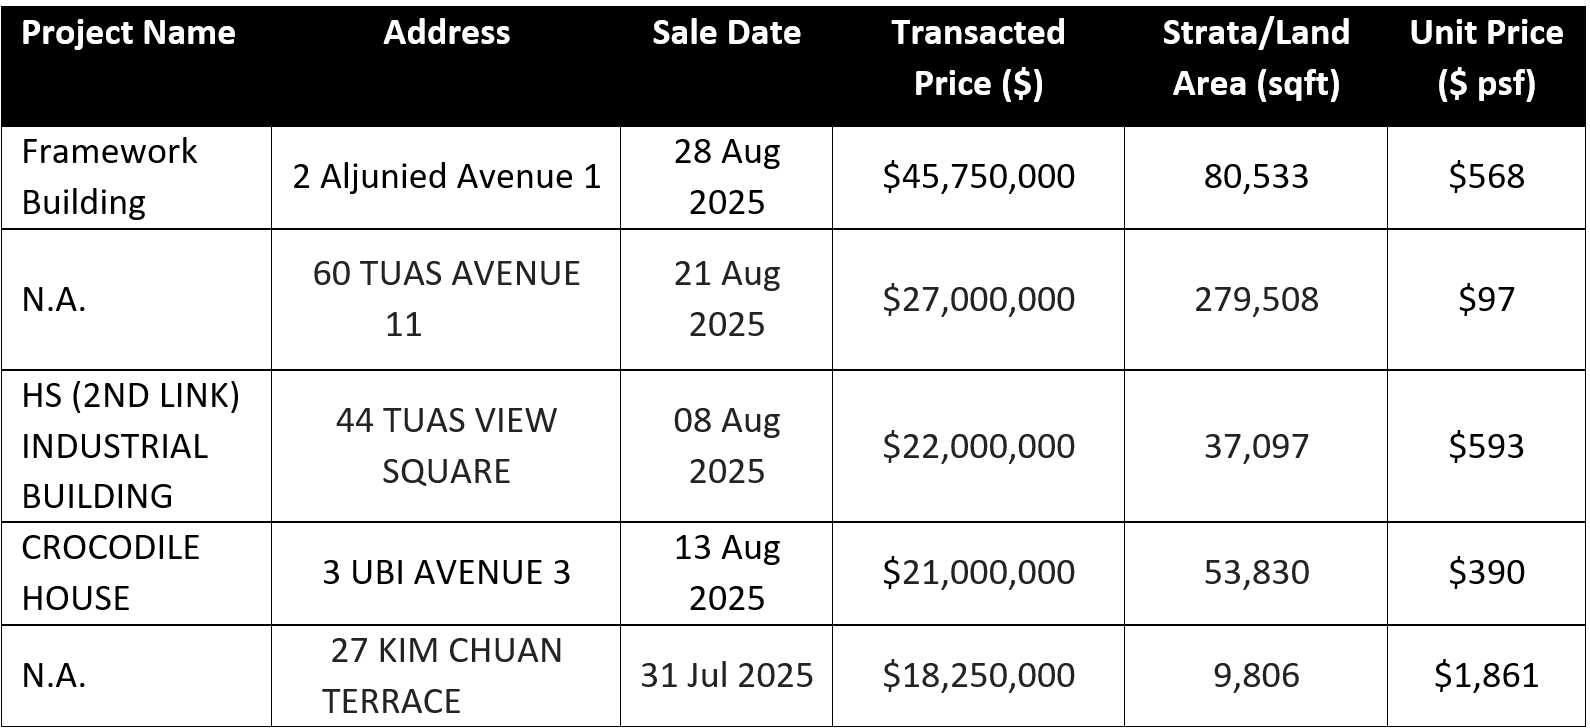
The largest deal in 3Q 2025 involved CapitaLand Ascendas REIT (CLAR) divesting five properties in August 2025 for a total of $329 million, reportedly to a consortium led by EZA Hill. This highest-value transaction was the sale of a five-storey ramp-up logistics property for $140 million. Other properties included 10 Toh Guan Road (The Furniture Mall, $84.5 million), 9 Changi South Street 3 ($51.5 million), and 31 Ubi Road 1 ($30 million). Three of these properties are logistics facilities, demonstrating investors' confidence in the sector.
Excluding the divested properties, the highest-value transaction was carried out by AIMS APAC REIT, which acquired the Framework Building at 2 Aljunied Avenue 1 for $47.8 million.
Table 1: Top Five Sales Transactions in 3Q 2025, based on caveats lodged
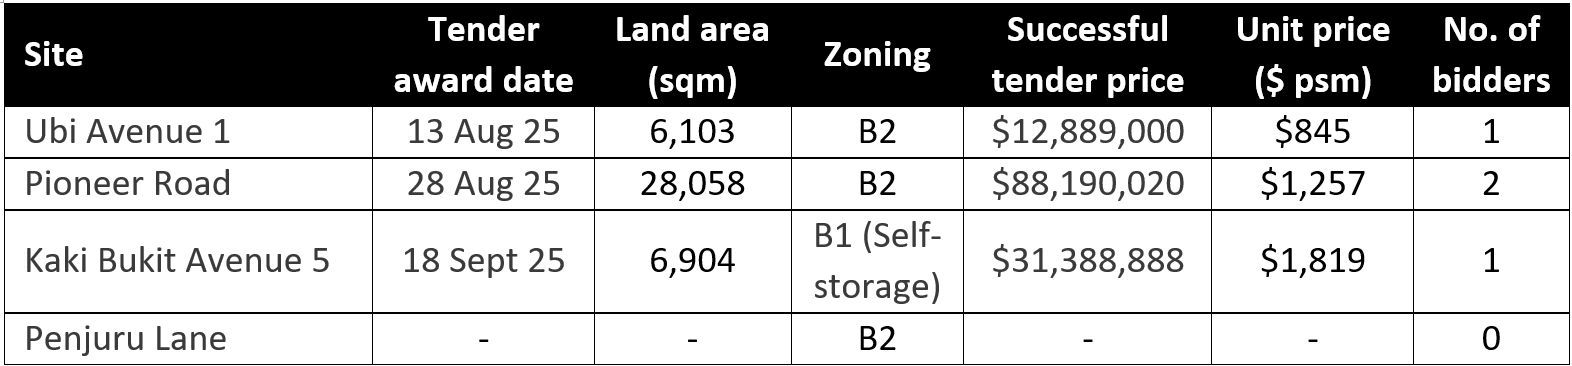
In the Industrial Government Land Sales (IGLS) sector, JTC awarded three industrial sites in 3Q 2025, while one site attracted no bidders.
Table 2: IGLS sites awarded in 3Q 2025
Leasing and Leasing Volume
The all industrial rental index continued its upward trend, increasing for the twentieth consecutive quarter in 3Q 2025. Rents rose by a further 0.5% quarter-on-quarter. This sustained growth highlights the resilience of Singapore’s industrial market even as global supply chains experience volatility.
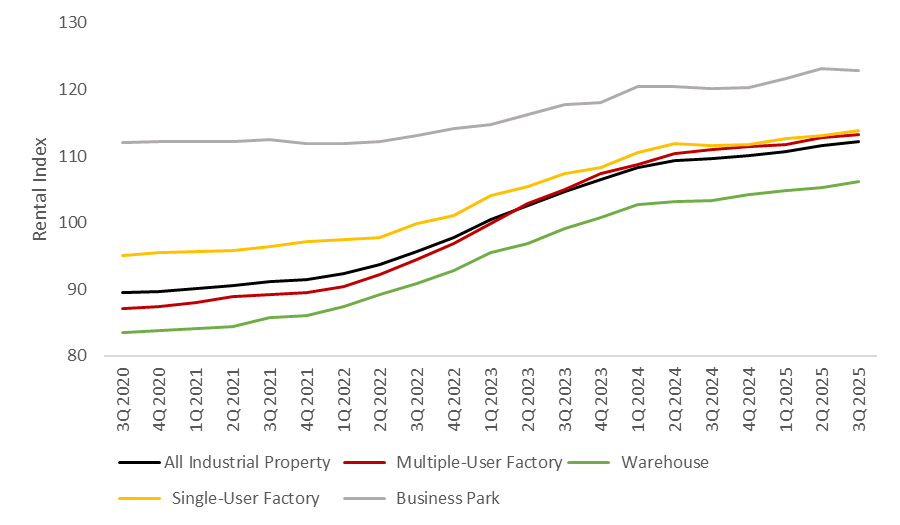
Notably, warehouse rents increased the most this quarter, rising by 0.9% quarter-on-quarter. Rents for single-user factories grew by 0.7% quarter-on-quarter, reflecting steady demand from manufacturing and engineering tenants. Meanwhile, rents for multi-user factories experienced a smaller rise of 0.4%, indicating that tenants may be more cautious in the multi-tenant sector, which generally serves SMES.
In contrast, business parks were the only segment to experience a decline in rental rates, decreasing by 0.2% quarter-on-quarter as the market continued to absorb vacant spaces from earlier completions. The varied performance across property types reflects differing sectoral conditions but still indicates a broadly stable rental environment.
Chart 6: Rental Index and Number of Tenancies for Industrial Properties
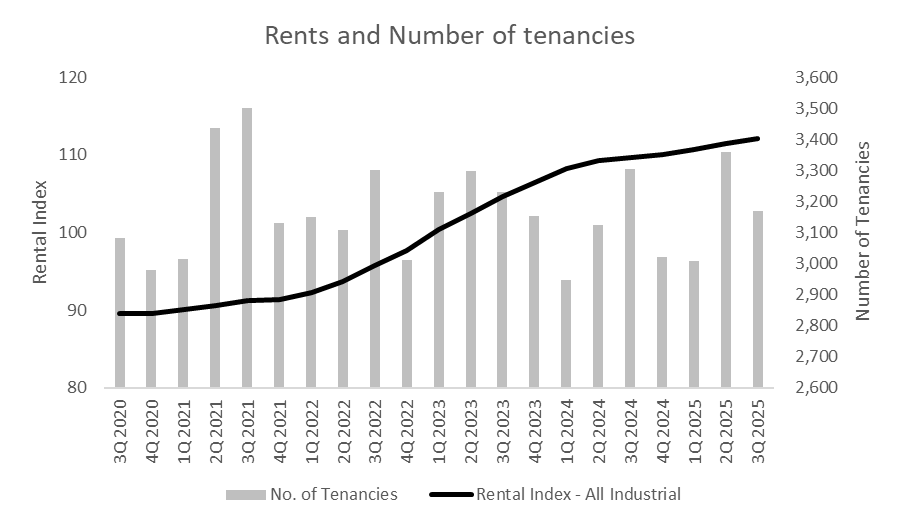
Chart 7: Rental Index By Property Type
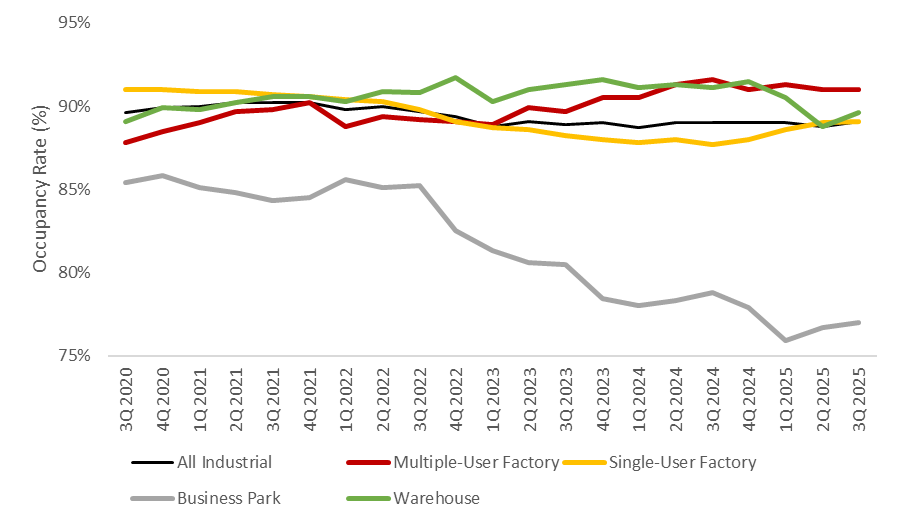
Occupancies across the industrial market remained stable in 3Q 2025, rising slightly to 89.1%, up from 88.8% in the previous quarter. This reflects healthy absorption supported by steady take-up of the new supply completed during the period. The ongoing supply pipeline has helped ease vacancy pressures amid broader global economic uncertainties.
Among the segments, warehouse occupancy recorded the strongest increase of 0.8%, aligning with the robust rental performance this quarter. Business parks also experienced a modest 0.3% rise, indicating that vacancy challenges may be easing as more tenants occupy space. Meanwhile, multiple-user and single-user factories remained largely unchanged, reflecting steady and predictable demand from occupiers.
The overall stability in occupancy rates demonstrates that demand for industrial space remains resilient, even in a quarter where leasing transactions softened. This suggests that tenants are retaining their spaces rather than downsizing, likely due to sustained manufacturing activity, supply chain diversification, and Singapore’s reputation as a reliable and global manufacturing hub. The balanced supply pipeline and consistent tenant demand support stable and resilient rental growth as the market moves into 4Q 2025.
Chart 8: Industrial Properties Occupancy Rates
Upcoming Supply
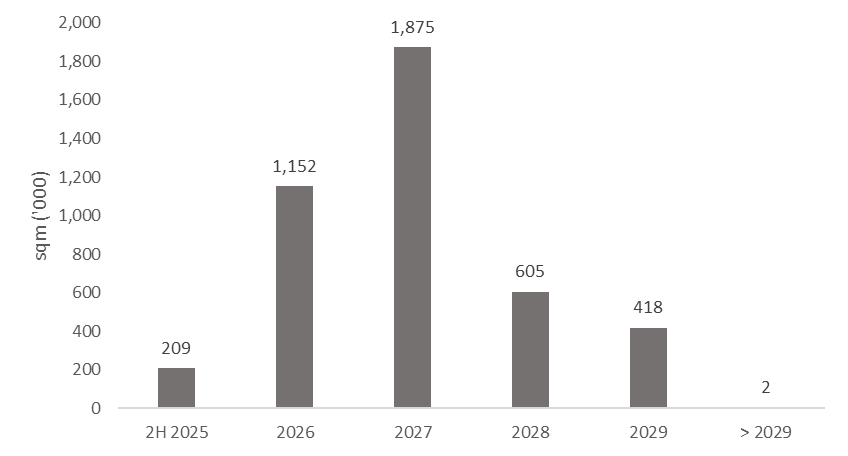
Q3 2025 saw the completion of eight developments, totalling 207,570 sqm. Notable developments include CT Foodnex at Mandai (18,650 sqm) and a warehouse development at 15 Benoi Sector (105,220 sqm).
Looking ahead to 4Q 2025, another 12 new industrial developments are scheduled for completion, adding 180,600 sqm of industrial space to the market. Notable developments include Bulim Square by JTC Corporation (74,780 sqm) and a single-user industrial project at Pasir Ris Industrial Drive 1 (37,520 sqm).
This array of completions could meet the demand for industrial spaces. Since some of these leases have already been pre-committed, the occupancy rate is expected to stay stable.
Chart 9: Supply of Industrial Spaces' Expected Completion Year
In conclusion
As the global economy shifts towards a multipolar world order, Singapore may be well-positioned to attract offshoring demand, especially in the advanced manufacturing sectors. This is due to Singapore’s lower trade tariff of 10% and its extensive free trade agreements. If this occurs, the resulting investment inflows are likely to generate positive downstream effects on SMEs in supporting industries.
Amid slower economic growth compared to earlier quarters, the outcome of the December rate cut decision remains uncertain. However, a rate cut, if implemented, could attract investors and business owners who have been adopting a ‘wait-and-see’ approach back into the market. This renewed confidence, supported by a surge of upcoming supply for the rest of the year, is likely to boost activity and support a stronger year-end performance.
Interest in industrial spaces has increased over the past few weeks, driven by both end-users seeking expansion and investors looking for good deals in the market. The low interest rate environment has helped maintain the market momentum. Similarly, investors are showing greater interest in securing yield-enhancing industrial assets or freehold properties. This offers them the chance for potential long-term capital appreciation, particularly in central areas. However, buyers remain cautious about operating costs, and global uncertainty continues to persist. As a result, price growth is expected to be more gradual.
Collectively, the Industrial Property Price Index and Rental Index increased by 3.5% and 1.7% respectively over the first three quarters of 2025. We are on course to meet our earlier forecast – a rise of between 3% to 5% in industrial prices, and an increase of between 2% to 4% in industrial rents.
I confirm that I have read theprivacy policy and allow my information to be shared with this agent who may contact me later.