3Q 2025 Rental Report: Rental Market Momentum Underpinned By Growing Foreign Workforce and Increasing Interim Rental Demand from Homeowners
- Wong Shanting
- 5 min read
- Research
- 20 Nov 2025
The rental market continued to grow steadily, exceeding expectations in 2025. This growth was fuelled by an increasing foreign workforce and a buoyant new home sales market, with more homeowners choosing to sell first and rent temporarily while waiting for their new homes to be completed.
Between December 2024 and June 2025, the foreign workforce increased by 0.8% to 824,400. The increase was driven mainly by work permit holders, while the number of Employment Pass and S Pass holders declined. Separately, the strength of the new sales market continued to drive resale activity, possibly leading to interim rental demand homeowners who had to sell their existing properties and were waiting for their new homes to be completed. In the first nine months of 2025, new home sales exceeded 10,000, significantly higher than the 6,469 units in 2024.
Separately, the 15-month wait-out period also contributed modestly to leasing activity, as a small group of private property right-sizers choose to rent before becoming eligible to purchase a HDB flat.
Advance estimates from the Ministry of Manpower, showed better than anticipated labour force labour market conditions in 3Q 2025, supported by sustained economic growth although downside risks persist, stemming from ongoing trade tensions and looming economic uncertainty.
Rental Index rose for the fifth quarter
The All-Residential Rental Index increased for the fifth consecutive quarter, rising 1.2% q-o-q to 161.7 in 3Q 2025, marking the fastest pace of rental growth in over a year. This momentum was largely driven by the landed segment, where rents surged 2.4% q-o-q, reflecting healthy demand for larger living spaces. Since 4Q 2024, the All-Residential Rental Index has risen collectively by 2.4%.
Meanwhile, non-landed rents grew by 1.1% q-o-q, marking a faster pace of growth compared to earlier quarters. Within this segment, rents at the OCR and RCR rose 2.5% and 1.8% q-o-q respectively, while the CCR reported a modest 0.5% decline.
Chart 1: Rental Index of Private Residential Properties
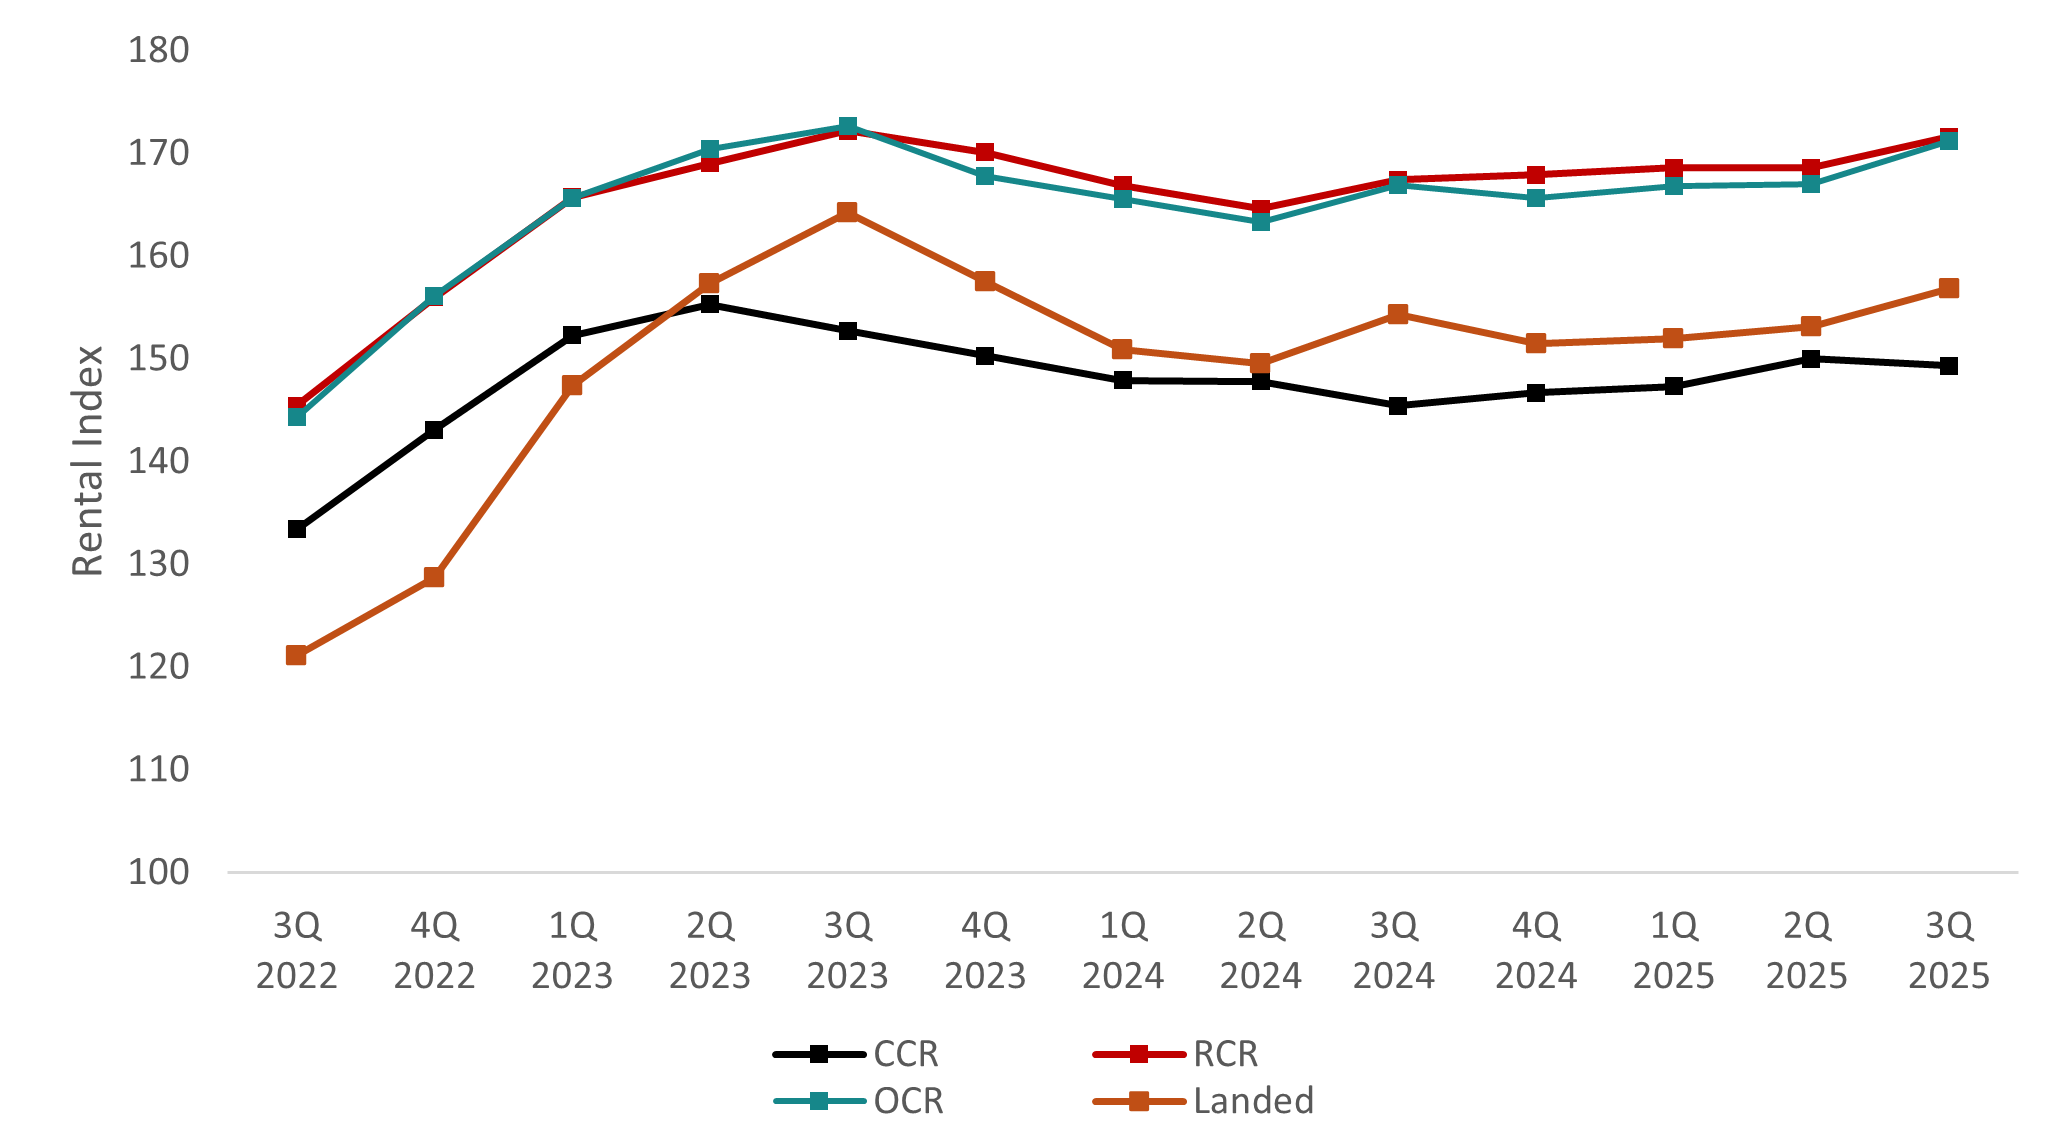
Source: URA, ERA Research and Market Intelligence
Rental contracts reached a new peak, highest since 3Q 2021
Some 27,530 rental contracts were lodged in 3Q 2025 marking a 3.5% jumped compared to the same period last year. This also marked the highest rental contracts lodged since 3Q 2021 which saw 27,612 contracts. Among the top ten projects with highest rental contracts were Normanton Park, Midtown Modern and The Sail @ Marina Bay.
Landed rental contracts dropped to a three-quarter low of 1,502 contract, exerting upwards pressure on rents in a supply-constrained environment.
Chart 2: Private residential rental contracts
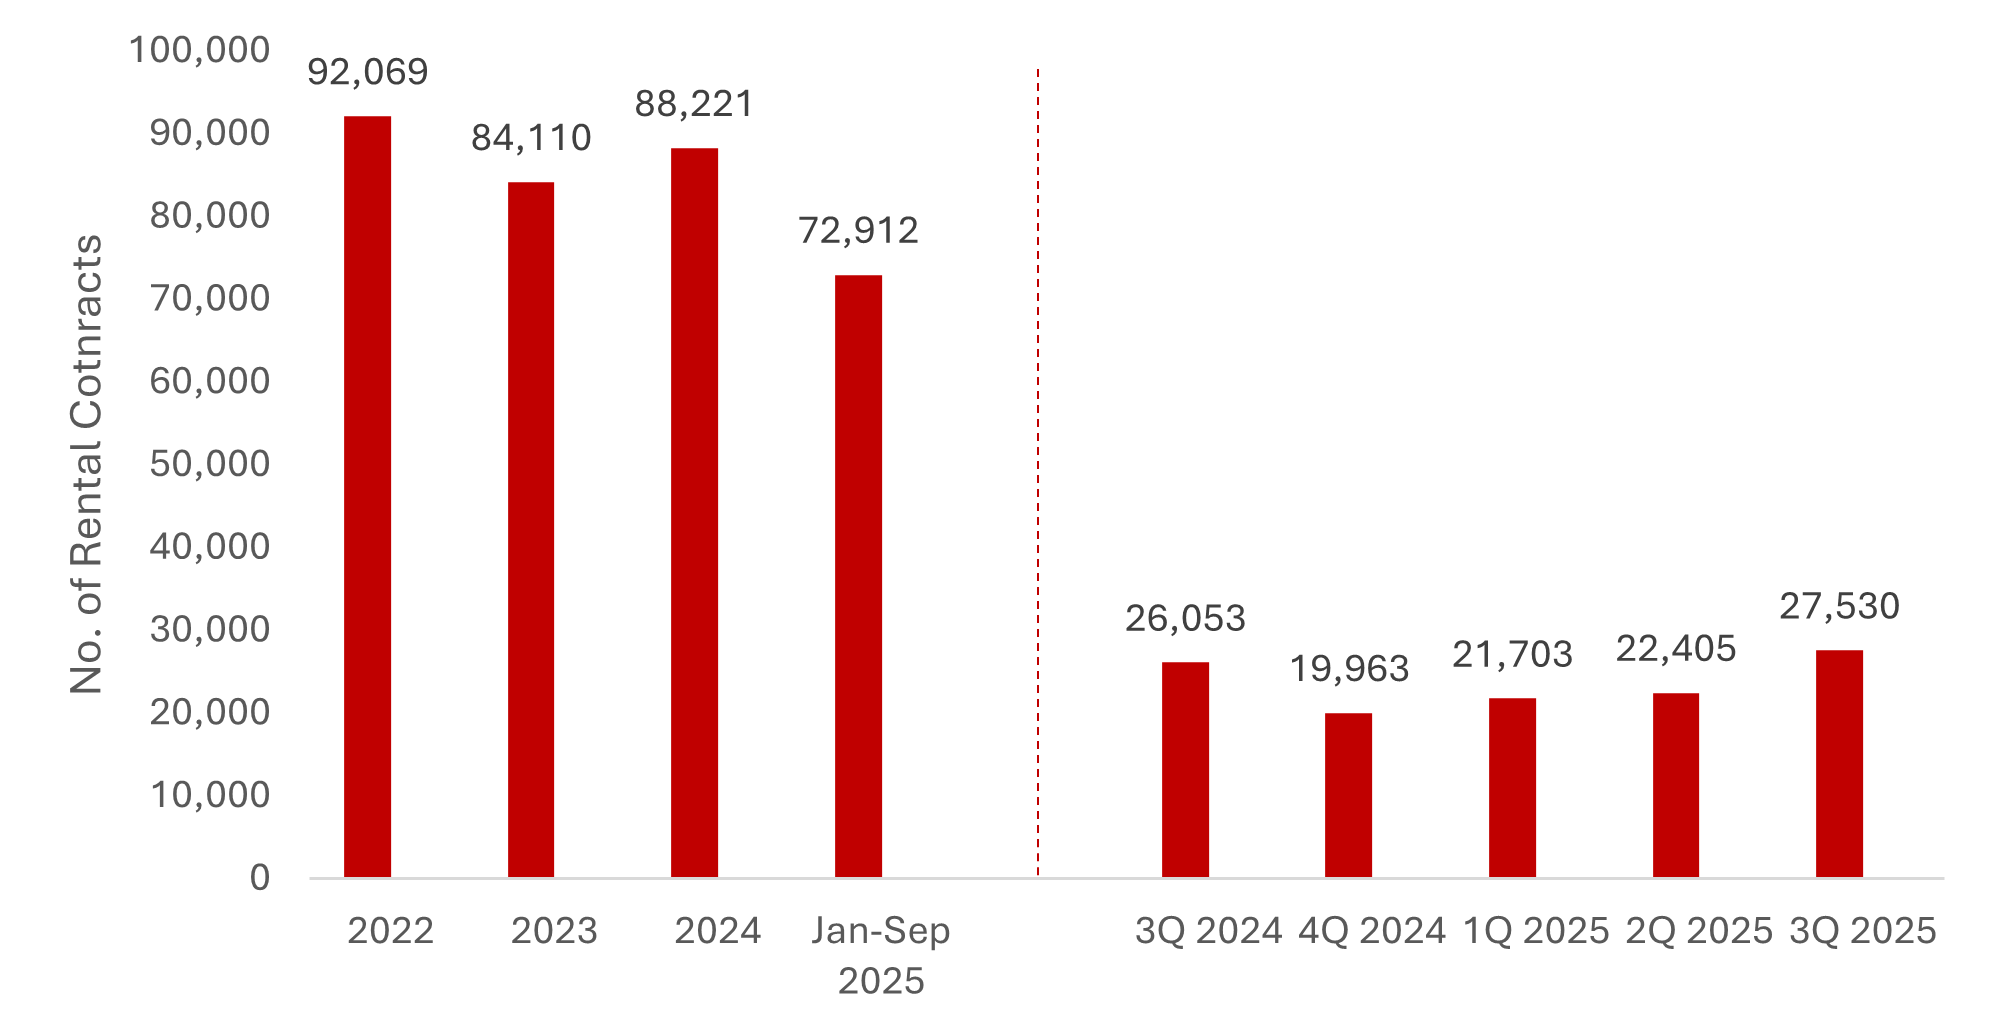
Source: URA as of 19 November 2025, ERA Research and Market Intelligence
Table 1: Top 10 projects based on Rental Contracts
No. | PROJECT | POSTAL DISTRICT | RENTAL CONTRACTS | |
1 | NORMANTON PARK | 5 | 199 | |
2 | MIDTOWN MODERN | 7 | 157 | |
3 | THE SAIL @ MARINA BAY | 1 | 156 | |
4 | PARC RIVIERA | 5 | 152 | |
5 | LAKEVILLE | 22 | 148 | |
6 | J GATEWAY | 22 | 145 | |
7 | LAKE GRANDE | 22 | 145 | |
8 | D'LEEDON | 10 | 143 | |
9 | STIRLING RESIDENCES | 3 | 131 | |
10 | MARINA ONE RESIDENCES | 1 | 128 | |
Source: URA, ERA Research and Market Intelligence Rentals expected to stay firm with tight supply of Completion
3Q 2025 saw the completion of Lentor Modern (OCR), One Bernam (CCR) and Piccadilly Grand (RCR) that will collectively add over 1,300 new homes to the market, offering tenants a wider selection of homes.
Table 2: Projects completed in 3Q 2025
Project | Market Segment | District | Units |
Lentor Modern | OCR | 20 | 605 |
One Bernam | CCR | 2 | 364 |
Piccadilly Grand | RCR | 8 | 407 |
Source: URA, ERA Research and Market Intelligence
A steady stream of completions in the first half of 2025 raised vacancy rates higher, although this is seen largely as a tech correction and vacancy has since started to stabilise as the market gradually absorbs the new supply.
For 2025, we maintain our forecast for islandwide rents to grow by 3%–5% as the market continues to adjust to the increased supply. However, we are revising our projection for private home rental contracts upward, with volumes now expected to reach between 88,000 and 93,000.
Table 3: Vacancy Of Private Residential Properties By Market Segment
Year/Quarter | Vacancy Rate – Island-wide (%) | Vacancy Rate – CCR (%) | Vacancy Rate – RCR (%) | Vacancy Rate – OCR (%) |
3Q 2024 | 7.2% | 11.2% | 8.1% | 4.9% |
4Q 2024 | 6.6% | 10.0% | 7.3% | 4.7% |
1Q 2025 | 6.5% | 10.3% | 6.6% | 4.7% |
2Q 2025 | 7.1% | 10.7% | 7.2% | 5.6% |
3Q 2025 | 6.9% | 9.9% | 6.7% | 5.6% |
Source: URA, ERA Research and Market Intelligence
HDB rental transactions volume highest since 2021
Median rents for HDB flats continued to rise across all room types in 1H 2025. On average, median rents for 3-room, 4-room and 5-room units rose by 1.4%, 2.0% and 1.6% year-on-year respectively.
However, the number of approved HDB rental applications grew at a much faster pace, surging by about 30% q-o-q and 44% y-o-y. This also marked the highest rental application in a quarter since 2021. This significant increase was likely supported by the increase in work permit applications observed in 1H 2025, which typically drives demand for more affordable rental homes.
Similar to the private market, a substantial rental demand is coming from interim rental demand from homebuyers, including those waiting for the completion of their new home, as well as private property owners affected by the 15-month wait-out period.
Table 4: 3Q 2025 HDB median rents by town and y-o-y growth
| 3Q 2025 | y-o-y | |||||||||||||
Town | 3-Room | 4-Room | 5-Room | Executive |
| Town | 3-Room | 4-Room | 5-Room | Executive | ||||
Ang Mo Kio | $2,800 | $3,440 | $3,800 | - |
| Ang Mo Kio | 1.8% | 4.2% | 5.6% |
| ||||
Bedok | $2,700 | $3,300 | $3,600 | - |
| Bedok | 0.0% | 3.1% | 0.0% |
| ||||
Bishan | $3,000 | $3,600 | $4,000 | - |
| Bishan | 0.0% | 1.4% | -2.4% |
| ||||
Bukit Batok | $2,600 | $3,250 | $3,600 | $4,080 |
| Bukit Batok | 0.0% | -1.5% | 0.0% | 7.4% | ||||
Bukit Merah | $3,000 | $4,000 | $4,250 | - |
| Bukit Merah | 1.4% | 2.6% | -1.2% |
| ||||
Bukit Panjang | $2,700 | $3,000 | $3,250 | $3,500 |
| Bukit Panjang | 8.0% | 0.0% | 1.6% |
| ||||
Bukit Timah | - | - | - | - |
| Bukit Timah |
|
|
|
| ||||
Central Area | $3,200 | $4,300 | - | na |
| Central Area | 0.0% | 2.4% |
|
| ||||
Choa Chu Kang | $2,500 | $3,000 | $3,300 | $3,500 |
| Choa Chu Kang | -5.7% | 0.0% | 0.0% | 0.0% | ||||
Clementi | $3,000 | $4,000 | $4,350 | - |
| Clementi | 0.0% | 2.6% | 0.0% |
| ||||
Geylang | $2,800 | $3,500 | $4,100 | - |
| Geylang | 0.0% | 4.5% | 7.9% |
| ||||
Hougang | $2,700 | $3,200 | $3,500 | $3,730 |
| Hougang | 3.8% | 0.0% | 2.9% | 3.6% | ||||
Jurong East | $2,800 | $3,500 | $3,800 | $4,150 |
| Jurong East | 3.7% | 2.9% | 2.7% | 2.5% | ||||
Jurong West | $2,700 | $3,500 | $3,800 | $3,800 |
| Jurong West | 1.9% | 2.9% | 1.3% | -5.0% | ||||
Kallang/Whampoa | $3,000 | $3,700 | $4,200 | - |
| Kallang/Whampoa | 3.4% | 2.8% | 5.0% |
| ||||
Marine Parade | $3,000 | $3,400 | - | na |
| Marine Parade | 3.4% | 3.0% |
|
| ||||
Pasir Ris | - | $3,300 | $3,500 | $3,900 |
| Pasir Ris |
| 3.1% | 0.0% | 1.8% | ||||
Punggol | $2,800 | $3,200 | $3,300 | - |
| Punggol | 3.7% | 0.0% | 1.5% |
| ||||
Queenstown | $3,000 | $4,200 | $4,300 | - |
| Queenstown | 0.0% | 5.0% | 0.0% |
| ||||
Sembawang | - | $3,150 | $3,300 | $3,430 |
| Sembawang |
| 1.6% | 3.1% | -2.0% | ||||
Sengkang | $2,800 | $3,200 | $3,300 | $3,500 |
| Sengkang | 0.0% | 1.6% | 0.0% | 2.9% | ||||
Serangoon | $2,800 | $3,400 | $3,500 | - |
| Serangoon | 0.0% | 6.3% | 0.6% |
| ||||
Tampines | $2,800 | $3,440 | $3,800 | - |
| Tampines | 3.6% | 3.0% | 3.4% | 0.0% | ||||
Toa Payoh | $2,700 | $3,300 | $3,600 | - |
| Toa Payoh | 3.6% | -5.3% | 0.0% |
| ||||
Woodlands | $3,000 | $3,600 | $4,000 | - |
| Woodlands | 0.0% | 0.0% | 3.1% | -2.8% | ||||
Yishun | $2,600 | $3,250 | $3,600 | $4,080 |
| Yishun | -0.8% | 3.3% | 3.0% |
| ||||
Average | $2,823 | $3,450 | $3,700 | $3,735 |
| Average | 1.4% | 2.0% | 1.6% | 0.2% | ||||
Source: HDB, ERA Research and Market Intelligence
(-) Indicates that there are no rental transactions in the quarter
* Indicates that the median rent is not shown because there are less than 20 rental transactions in the quarter for that particular town and flat type
Chart 3: Number of rental approvals for HDBs
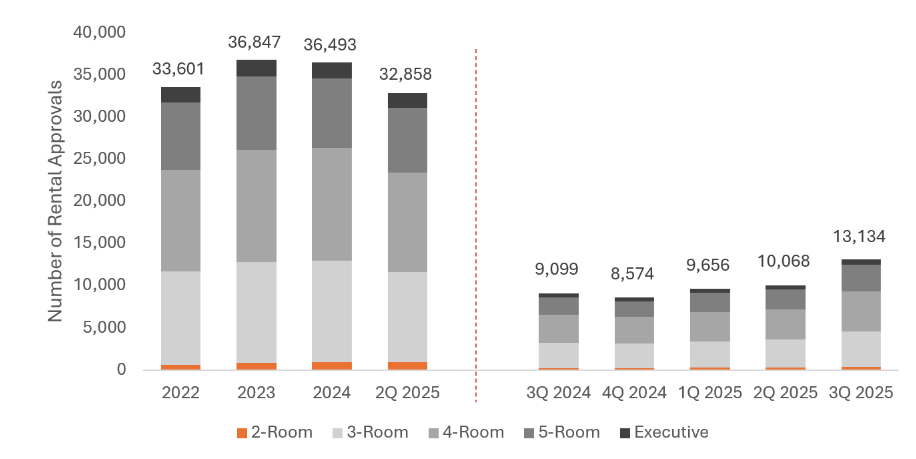
Source: HDB, ERA Research and Market Intelligence
ERA estimates that average HDB rents across all room types could rise by 2%–5% year-on-year in 2025. Strong new home sales have unexpected boosted interim rental demand. In the first nine months of 2025 alone, HDB rental applications reached 32,868.
Given the stronger-than-expected demand, ERA has revised its earlier rental forecast from 36,000–38,000 applications to a higher range of 40,000–42,000 for the full year.
Singapore’s rental market is projected to remain resilient driven by interim rental demand from homeowners
As the supply of newly completed private homes and HDB flats continues to taper downward, rental rates are expected to trend upward through 2025 and into 2026. Unexpected interim rental demand from homeowners is likely to further support the market in 4Q 2025. Although the rental market remains resilient, ongoing macroeconomic uncertainties and global trade tensions may introduce poise some downside risks.
Singapore’s rental market is projected to stay stable, with gradual rent increases supported by strong take-up rates and limited new supply. Steady demand, coupled with cautiously optimistic market sentiment, suggests that the market will remain resilient in the short to medium term.
I confirm that I have read theprivacy policy and allow my information to be shared with this agent who may contact me later.